.svg) Product
Product


Table of content
The 6 TA metrics that actually matter to your CFO (and how to calculate them)
Talent acquisition leaders walk into quarterly business reviews armed with activity metrics like applications received, time to fill, source mix, and diversity ratios. The CFO listens politely, then asks one question: what is this costing us, and what are we getting in return?
This article walks through six recruitment metrics that actually move CFO conversations, with the formulas to calculate them and the context to defend them. They are not the only TA KPIs worth tracking, but they are the ones that shift the budget conversation from defensive to strategic.
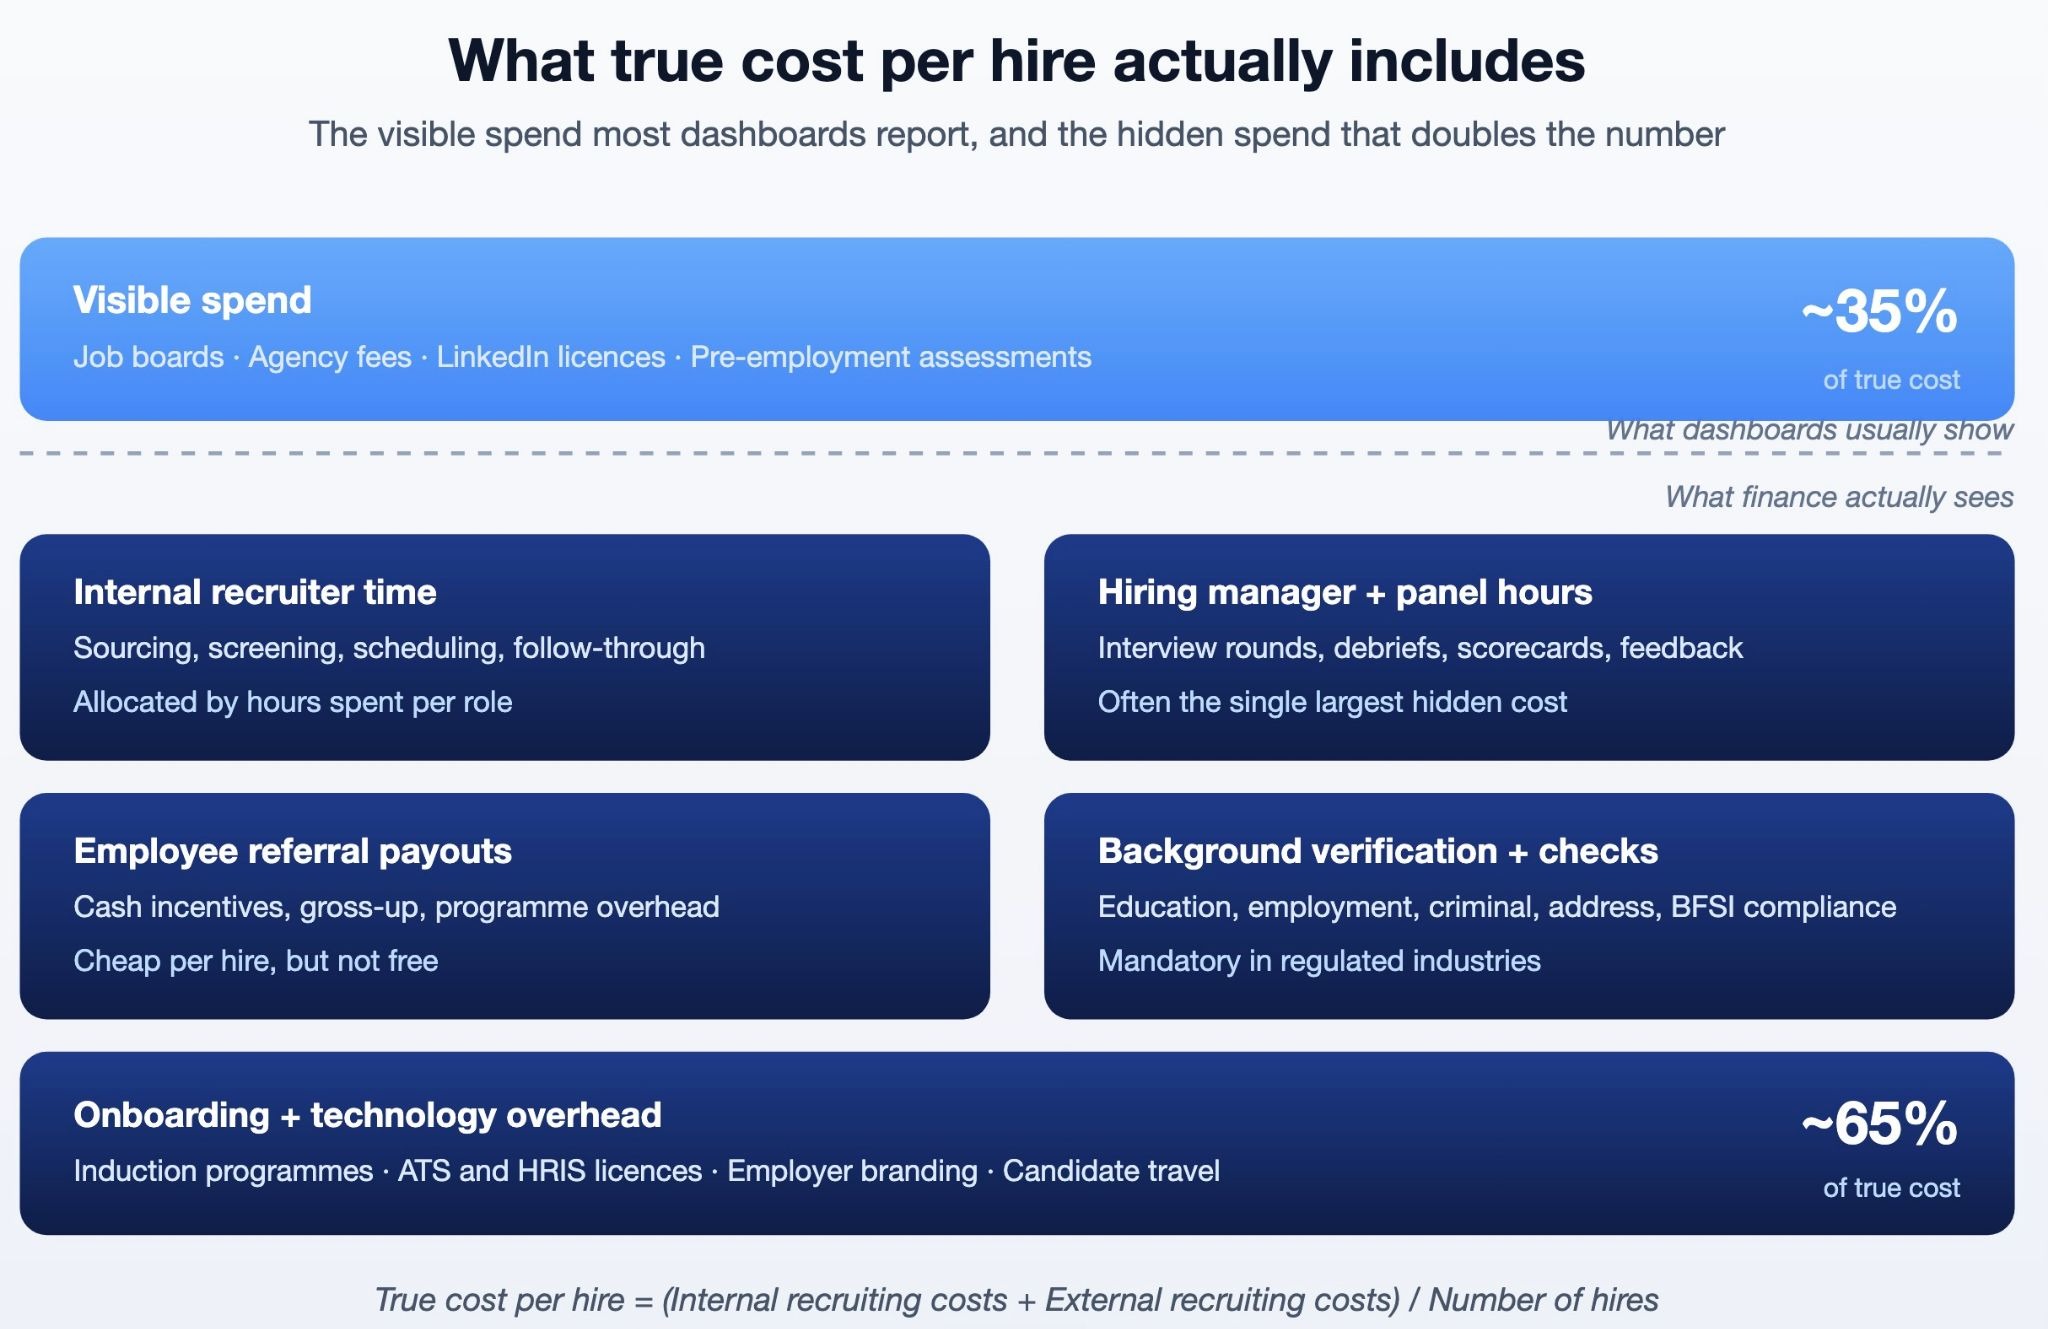
True cost per hire (the number behind the number)
Many TA dashboards show cost per hire as job board spend plus agency fees, divided by total hires. The figure looks tidy on a slide. Your CFO sees through it immediately because it ignores everything that actually consumes the recruiting budget.
True cost per hire pulls in every direct and indirect cost over a defined period, then divides by hires made in that period.
Formula to calculate true cost per hire
True cost per hire = (Internal recruiting costs + External recruiting costs) / Number of hires
What goes into each bucket
- Internal: Recruiter salaries allocated by time, hiring manager and panel hours, referral payouts, ATS and assessment licences, onboarding programme costs.
- External: Job board and social spend, agency fees, background verification, employer branding, candidate travel.
Vacancy cost (the meter that runs every day)
When a role stays open, work does not stop. It gets absorbed by stretched teams, paid out as overtime, or shifted to expensive contractors. Your CFO sees this as monthly expense variance and wants to know why finance is funding the gap that TA cannot close.
This metric gives the open requisition a daily price tag, which changes how hiring managers think about delays in interview slots.
Formula to calculate vacancy cost
- For revenue-generating roles: Daily vacancy cost = Annual revenue per employee in that function / 260 working days
- For cost-centre roles: Daily vacancy cost = (Fully loaded salary + overtime or contractor premium) / Working days
- Total vacancy cost = Daily vacancy cost x Days the role stayed open
A relationship manager role at a wealth management firm typically carries an AUM target. Every day the seat is empty, the firm loses fee income from accounts not onboarded and referrals not made. A 60-day vacancy in such a role can run into several lakhs in foregone revenue, before adding the cost of stretched coverage on the existing book.
Vacancy cost is also why CFOs prefer to fund proactive sourcing pipelines rather than emergency agency mandates after a role has already been open for 45 days.
Time to productivity (when the hire starts paying back)
Time to hire ends the day the offer is accepted. Time to productivity ends the day the new employee delivers at expected output. The gap between the two is where most of the financial value of hiring sits, and it almost never appears on a TA dashboard.
This metric matters because it reveals whether you are hiring the right people, not just hiring people fast.
Formula to calculate time to productivity
Time to productivity = Days from start date to the date the new hire consistently meets defined output benchmarks for the role.
Benchmarks must be agreed with the hiring manager before the role is opened. For a credit underwriter, the benchmark could be processing a set number of files independently per week. For a software engineer at, it could be merging code into production without senior review. For a branch manager, it could be hitting 80% of the assigned target for two consecutive months.
When IT services firms ramp up project teams, every week saved on ramp-up time translates directly into billable revenue. Shaving two weeks off time to productivity across 200 hires in a quarter can move the services margin by a measurable point, which is exactly the kind of number a CFO can take into a board meeting.
Quality of hire (the metric that justifies the spend)
Quality of hire is the single composite that tells your CFO whether the recruiting investment is producing the workforce the business actually needs. It is also the metric TA teams most often avoid, because it depends on inputs they do not directly own.
A defensible quality of hire score blends three inputs measured at the 12-month mark.
Formula to calculate quality of hire
Quality of hire = (Performance rating % + Engagement or retention score % + Hiring manager satisfaction %) / 3
Each input is expressed as a percentage of its maximum score. Lower scores rarely point to recruiter performance alone. They point to gaps in screening criteria, panel calibration, or the onboarding programme.
Pair this metric with cost per hire and you get cost per quality hire, which is the number CFOs use to compare sourcing channels honestly. An expensive channel that delivers high-quality hires often beats a cheap channel that delivers churn. Without this view, the cheapest channel always wins the budget debate, even when it is destroying value downstream.
First-year attrition rate (the cost of a hiring miss)
When a hire leaves within twelve months, the organisation loses the recruiting spend, the onboarding investment, the productivity ramp, and often the morale of the team that trained them. That cost lands on the CFO's quarterly review, and it compounds when the pattern repeats.
Formula to calculate first-year attrition rate
First-year attrition rate = (Number of hires who exited within 12 months / Total hires in the cohort) x 100
Track it by source, by function, and by hiring manager. The pattern almost always points to a fixable root cause:
- Sourcing channel with poor cultural or skill fit
- Compensation benchmarking out of step with the live market
- Job preview that overstates the role
- Onboarding programme that loses people in the first 90 days
When organisations break first-year attrition down by source, function, and hiring manager, the diagnosis is usually structural rather than a recruiter performance issue.
In manufacturing, plant-floor roles tend to show higher early exits than corporate roles, with onboarding quality and shift-induction practices doing more to explain the gap than pay. In IT services, project-based hires often leave within the first six months when bench expectations were not matched honestly against the job preview at offer stage. In retail and consumer brands, first-year exits cluster around stores where store managers have themselves had no structured induction.
The diagnostic value of this metric, not the headline percentage, is what earns CFO backing for the operational fix.
Recruitment ROI (the conversation closer)
Recruitment ROI is the metric that turns talent acquisition from a cost-centre conversation into an investment conversation. It is also the hardest to defend on its own. Without the previous five metrics behind it, the number looks like a slide rather than a P&L line.
Formula to calculate Recruitment ROI
Recruitment ROI = ((Value generated by hires - Total recruiting investment) / Total recruiting investment) x 100
Value generated should reflect the financial contribution of the cohort, defined by role type:
- Revenue roles (sales, relationship managers, business development): Revenue produced in the measurement window.
- Operations and tech roles: Cost saved or efficiency gained, quantified against a baseline.
- Risk and compliance roles: Loss avoided, fraud prevented, audit findings closed.
Total recruiting investment uses the true cost per hire from metric 1, multiplied by the cohort size, plus the replacement cost of any hires lost to first-year attrition.
The discipline of running this calculation matters more than the headline ratio. When a TA team tracks revenue or risk-avoidance impact for each cohort against fully loaded recruiting spend, four things become visible to the CFO:
- Which functions deliver the strongest return
- Which sourcing channels look cheap but destroy value
- Where bad-hire cost is concentrating
- How the trend is moving quarter over quarter.
Revenue-facing roles such as field sales, relationship managers, and business development hires are usually the easiest to attribute because their output already sits in the ledger the CFO reviews. Cost-centre roles need a baseline-versus-actual framing: time saved, error rates reduced, audit findings closed, compliance gaps avoided. The credibility comes from running this method consistently over four quarters, not from a one-time number on a slide.
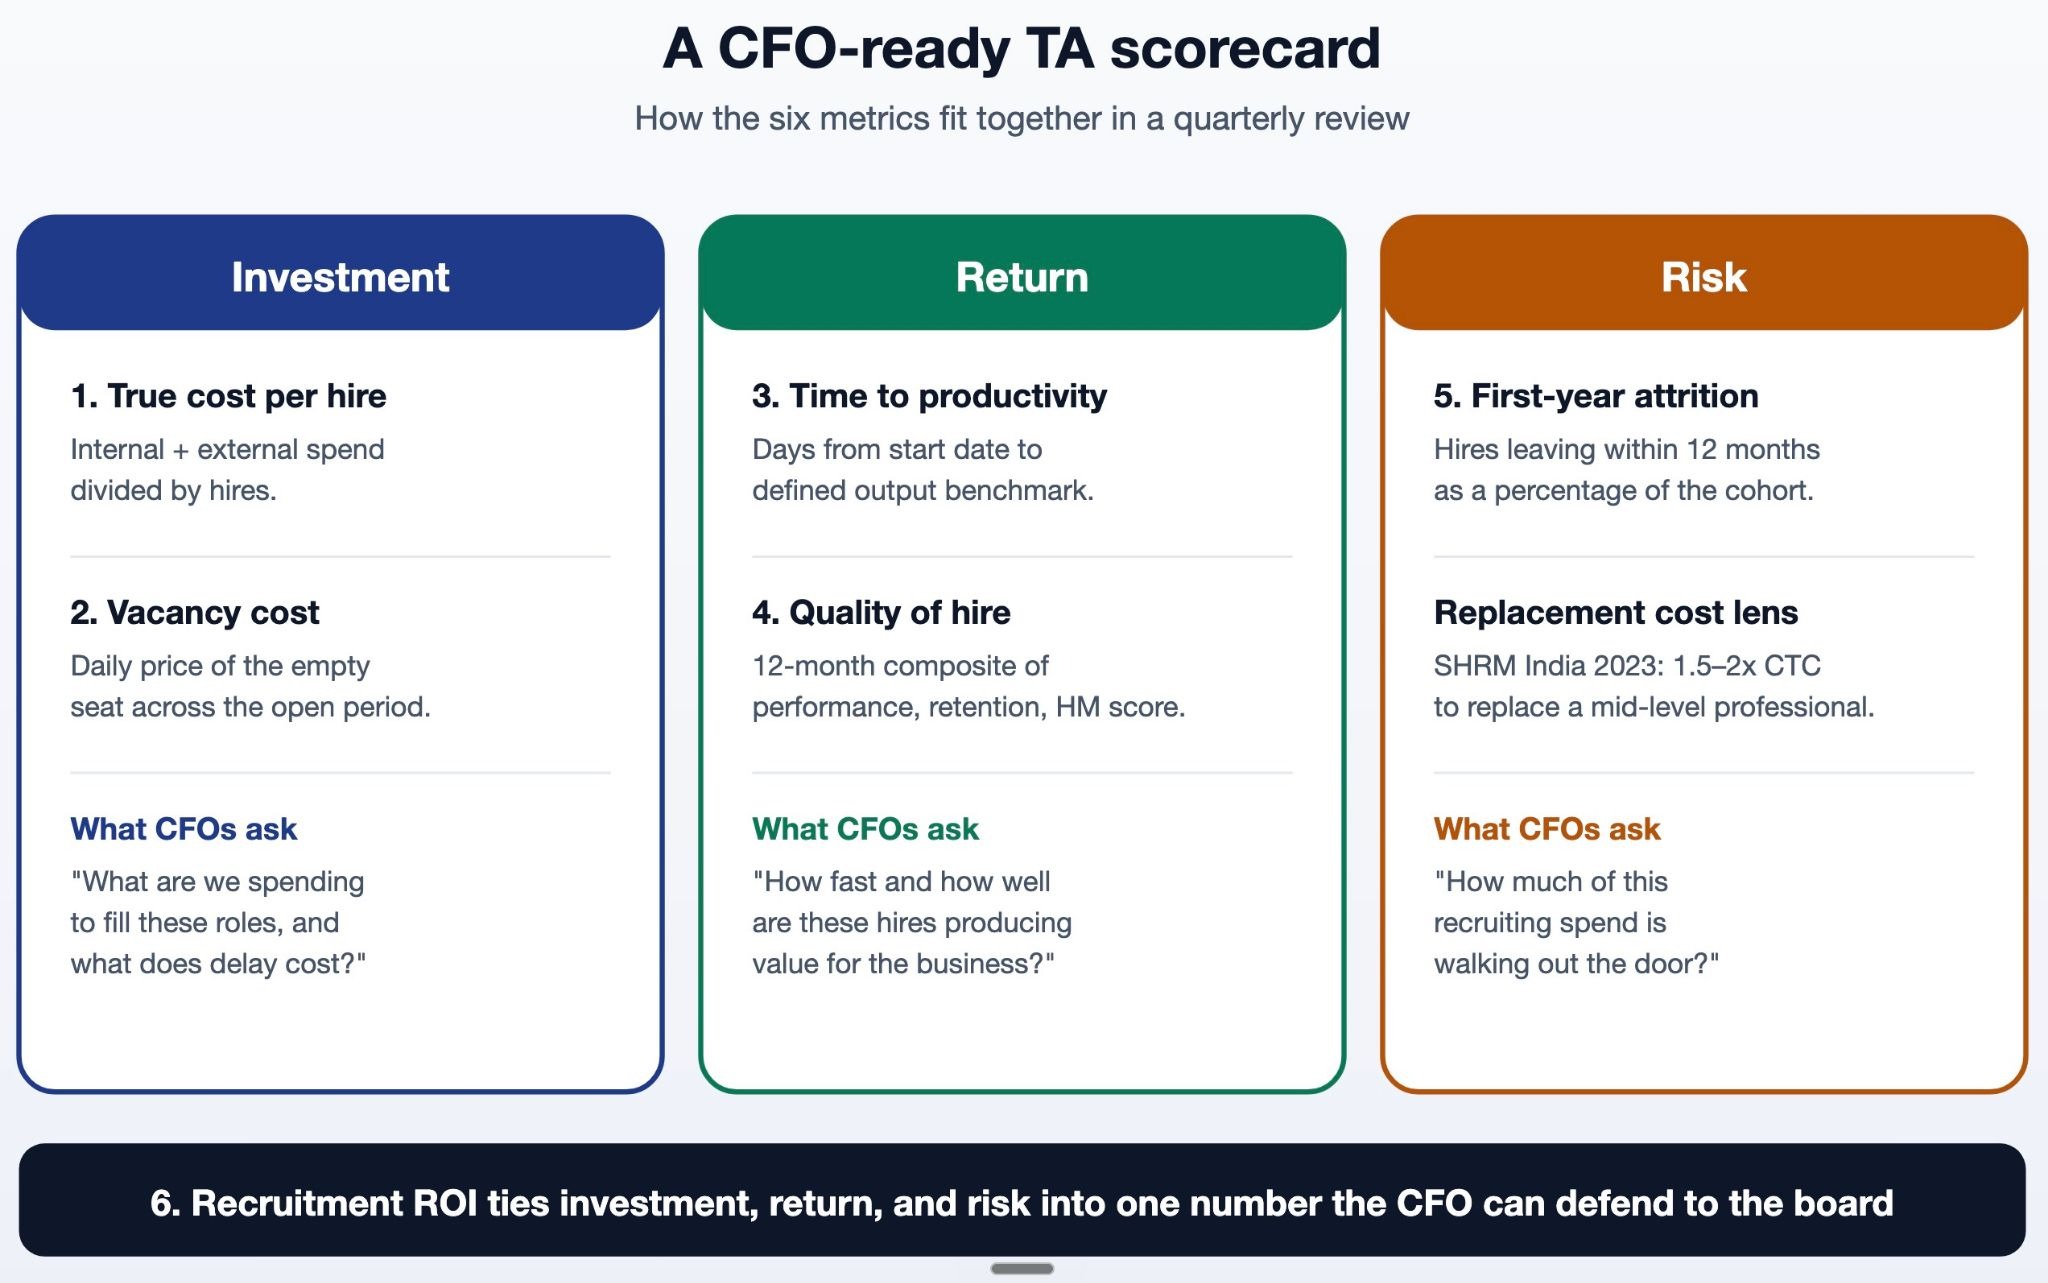
Putting it together: a CFO-ready TA scorecard
The six metrics work as a system, not a checklist. Cost per hire and vacancy cost capture investment. Time to productivity and quality of hire capture return. First-year attrition captures risk. Recruitment ROI ties the system together into a single number the CFO can use.
Three actions move the scorecard from spreadsheet to strategic asset:
- Agree the formulas with finance before publishing them, not after.
- Build the data infrastructure once, drawing from your HRIS, ATS, performance system, and finance ledger into a single reporting layer.
- Report quarterly with year-over-year context. CFOs do not want monthly noise; they want trends they can plan against.
The CHROs and TA heads who win budget battles are not the ones with the most metrics on their dashboard. They are the ones whose metrics speak the language of the business and translate hiring into outcomes the CFO can defend to the board.
Build the TA scorecard your CFO has been asking for
The reason these six metrics rarely reach the CFO in clean form is that the underlying data sits in five different systems. Cost numbers live in finance, candidate data in the ATS, performance in HRMS, attrition in a separate dashboard, and productivity often nowhere at all. That fragmentation is what an integrated TA platform fixes, and it is the difference between reporting activity and reporting outcomes.
RippleHire is the High-Performance AI ATS used by global enterprises like Axis Bank, Tata Steel, LTIMindtree, and Mphasis to run hiring at scale. It powers one hire every four minutes across 50+ countries for over a million users, with customer leaders citing reductions in time-to-fill, sharper cost control, and improved joining ratios as the operational outcomes that follow.
What you get on a single platform:
- Demand creation through to onboarding in one connected flow, so true cost per hire is calculated from a single source rather than reconciled across systems.
- Reporting and analytics across sourcing attribution, panel productivity, offer acceptance, and post-offer drop-off, with early-warning signals on joining likelihood.
- AI-powered fraud detection that flags resume anomalies and impostors at the interview stage before they become first-year attrition cost.
- Multi-country compliance management with audit trails for every activity, backed by ISO 27001, SOC 2 Type 2, and GDPR certifications.
- Integrations across your HRMS, sourcing partners, assessment platforms, and communication tools, so the layer your CFO reads is the same layer your TA team works in.
Book a demo to see how RippleHire turns the six metrics in this article into a quarterly scorecard you can take into your next board review.
Frequently Asked Questions
1. How do I start tracking talent acquisition metrics CFO teams care about?
Begin by aligning with your finance business partner on definitions before building any dashboard. Pick two metrics to start with, true cost per hire and first-year attrition rate, since both pull from data you likely already have in your ATS and HRIS. Agree on the formulas in writing with finance, set a quarterly reporting cadence, and add the remaining metrics only once the first two are running cleanly. Build credibility before expanding.
2. What is the difference between cost per hire and recruitment ROI?
Cost per hire is an input measure that captures what you spent to bring each hire on board. Recruitment ROI is an outcome measure that compares the financial value those hires generated against the total recruiting investment. Cost per hire tells you whether you are spending efficiently. Recruitment ROI tells you whether you are investing wisely. CFOs care about both, but the ROI figure is what reframes talent acquisition as an investment rather than a cost.
3. Who should own recruitment ROI reporting in an enterprise?
Recruitment ROI is best co-owned by the TA Head and the finance business partner for HR. TA defines the cohort, the role types, and the value drivers. Finance validates the cost numbers against the ledger and the value generated against the books. When one function owns it alone, the number loses credibility quickly. The partnership is what makes the metric defensible when it reaches the board.
4. How do you measure recruitment ROI for non-revenue roles?
For non-revenue roles, value generated should be expressed as cost saved, efficiency gained, or risk avoided, measured against a documented baseline. Operations hires typically map to throughput improvements or error reduction. Engineering hires map to delivery output or system reliability. Compliance, audit, and risk hires map to losses prevented or findings closed within a set window. The principle is to translate the role's contribution into a financial figure finance can verify on the books.
5. How often should TA metrics be reviewed with the CFO?
Quarterly is the right cadence for most enterprises. Monthly cuts create noise without enough signal, and annual reviews are too slow to course-correct on. Within each quarter, present the latest period alongside the prior four so trends are visible rather than single-point numbers. Pair the headline metrics with a short narrative on what changed and why, since CFOs respond more to direction of travel and root cause than to absolute figures.