
.svg) Product
Product


.png)


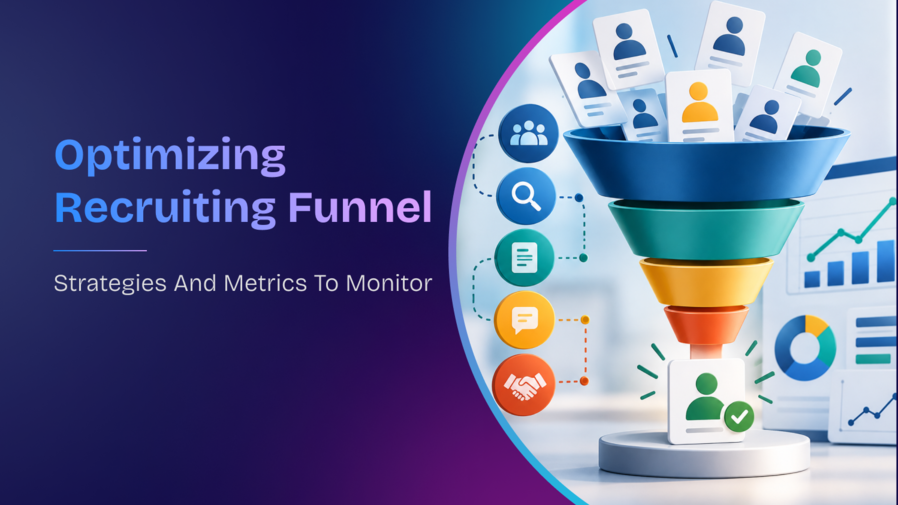


Table of content
Quick Answer A recruiting funnel maps the journey from first candidate contact to Day-1 joining. Most organizations track the beginning and the end. The stages in between where candidates actually drop off go unmeasured and unfixed.
Every recruiting funnel leaks. The question is where.
A funnel that loses candidates at the application stage has a different problem from one that loses them after the offer. Both show up as "unfilled roles" but they require completely different fixes.
This guide covers the eight stages of a recruiting funnel, the metric that diagnoses each stage, and the strategies that actually work at each level.
What is a recruitment funnel?
A recruiting funnel is the structured sequence of steps that takes a candidate from first awareness of a role to joining as an employee.
It is called a funnel because the number of people at each stage reduces as requirements become more specific. A role that starts with 400 applicants might produce 40 screened candidates, 15 interviewed candidates, 5 offers, and 3 joiners.
The funnel has eight distinct stages:
| Stage | What Happens | Who Is Responsible |
|---|---|---|
| Awareness | Candidate learns the role exists | Employer brand, job distribution, sourcing team |
| Application | Candidate submits an application | Recruiter, JD quality, application process design |
| Screening | Recruiter evaluates fit against role requirements | Recruiter, AI screening tools |
| Assessment | Candidate completes skills or behavioral evaluation | TA ops, assessment platform |
| Interview | Hiring manager and panel evaluate the candidate | Hiring manager, interview panel |
| Offer | Offer extended and negotiated | Recruiter, compensation team, hiring manager |
| Background check | Pre-employment verification completed | TA ops, BGV vendor |
| Onboarding | Candidate joins and becomes a productive employee | HR, hiring manager, IT |
Strategies to optimize the funnel for quality hires
Evaluate your recruitment needs before opening a role
Most funnel problems start before a single candidate applies.
A role opened without a clear brief produces a job description that attracts the wrong people. A job description that attracts the wrong people fills the top of the funnel with noise. By the time that noise reaches the screening stage, the recruiter is doing work that a better brief would have prevented.
Before opening a role, align on three things with the hiring manager:
- What does success look like at 90 days?
- Which skills are genuinely non-negotiable versus preferred?
- What is the realistic compensation range for the profile required?
These three questions surface misalignments that would otherwise show up as wasted screening time, poor shortlist quality, or late-stage offer rejections.
Track conversion at every stage
Most TA teams track total hires and total time to hire. Neither tells you where the funnel is breaking.
Stage-level conversion rates do.
If 400 candidates applied and only 8 made it to interview, the problem is not the interview process. It is sourcing quality or screening criteria. If 40 candidates reached the interview stage and only 3 received offers, the problem is panel calibration or role clarity. If 10 offers went out and 4 were accepted, the problem is compensation benchmarking or candidate experience.
The metric that diagnoses the problem is different at every stage. That is why tracking total conversion at the end tells you nothing useful about where to intervene.
Track these at minimum:
- Application completion rate
- Screening-to-interview conversion
- Interview-to-offer conversion
- Offer acceptance rate
- Offer-to-joining rate
Each one points to a specific stage. Each specific stage has a specific fix.
Build your action plan from the data
Once stage-level conversion data is available, the fix becomes clear.
Low application completion rate means the application process is too long or the job description is setting wrong expectations. Fix the JD or reduce the form fields.
Low screening-to-interview conversion means either the sourcing channel is sending the wrong candidates or the screening criteria are too rigid. Fix the source mix or separate prerequisites from preferred skills.
Low interview-to-offer conversion means panel calibration is inconsistent. Introduce structured scorecards so every interviewer evaluates against the same criteria.
Low offer acceptance rate means compensation is misaligned with the market or the process moved too slowly. Surface the range earlier and compress the interview-to-offer timeline.
Low offer-to-joining rate means post-offer engagement is insufficient. Build structured touchpoints through the notice period.
The action plan is not a generic process improvement exercise. It is a response to a specific number at a specific stage.
Make the experience worth remembering at every stage
Candidate experience affects two things most TA teams underestimate: offer acceptance rates and employer brand.
A candidate who had a poor experience during the process is less likely to accept an offer ,even a competitive one. A candidate who was rejected but treated well is more likely to reapply and more likely to refer others.
Three stages where experience most often breaks down:
Interview stage: Schedule quickly. Share the agenda before the call. Give feedback within 48 hours regardless of outcome. These three things alone produce a measurably better cNPS than most employer branding initiatives.
Offer stage: Do not make candidates wait. The gap between the final interview and the offer is where competing offers arrive. A process that takes 12 days to produce an offer after a final round loses candidates to organizations that take 3.
Post-offer and onboarding stage: A candidate who accepted an offer and then heard nothing for six weeks is a dropout risk. Structured communication during the notice period from the recruiter, from the hiring manager, from a team peer maintains the connection that converts an accepted offer into a Day-1 joiner.
Metrics to monitor at each stage of the funnel
Since recruitment is a combination of human efforts along with automation in the mix, it is important to track metrics of what’s working and where processes can become more streamlined.
Here are some key metrics to track–
1. Quality of hire
What it measures: How well a new hire performs against the expectations set at hiring.
Formula: Quality of hire = (Performance rating + Manager satisfaction + Retention at 12 months) / 3
Track first-year attrition by sourcing channel alongside it. If quality of hire is low for candidates from a specific channel, the problem is sourcing ,not screening.
A great way to improve this metric is by investing in structured interviews with defined role-specific criteria rather than relying on interviewer intuition.
2. Time to hire
What it measures: How long the hiring process takes from application to offer acceptance.
Formula: Time to hire = Date offer accepted minus date candidate entered pipeline
Track time per stage alongside overall time to hire. A 45-day process where 30 days sit in offer approval has a different fix than one where 30 days sit in interview scheduling.
3. Cost Per hire
What it measures: The total investment required to bring one person into the organization.
Formula: Cost per hire = (Direct costs + Indirect costs) / Number of hires in the period
Direct costs include job board spend, agency fees, background verification, and assessment costs. Indirect costs include recruiter time, hiring manager and panel interview time, and onboarding administration. Most organizations undercount cost per hire by omitting internal time costs.
Track cost per quality hire alongside it cost per hire multiplied by quality of hire score. A cheaper channel that produces poor-quality hires is more expensive than a slightly costlier channel that produces hires who stay and perform.
4. Source of application
What it measures: Which sourcing channels candidates are coming from and which channels produce candidates who advance furthest.
When one channel produces high application volume but low conversion at screening or interview, the channel is sending the wrong candidates. Volume is not the goal ,conversion quality is.
Track source-to-offer conversion rate per channel, not just source volume. Most applicant tracking systems surface this automatically.
Employee referrals consistently produce the highest conversion rates and the best quality-of-hire scores. If referrals are a small share of the source mix, the referral programme needs attention before additional sourcing spend is considered.
5. Diversity rate
What it measures: The representation of different groups across the candidate pipeline at each funnel stage.
A candidate pool that is diverse at application but narrows by the interview stage signals that screening criteria or interview processes are introducing bias ,intentional or not.
Track diversity rate at each funnel stage, not just at hire. A pipeline that starts diverse and ends homogeneous has a mid-funnel problem that aggregate diversity metrics at the hire stage will not reveal.
6. Candidate experience (cNPS)
What it measures: How candidates rate their experience throughout the hiring process regardless of outcome.
Formula: cNPS = Percentage of promoters (score 9 to 10) minus percentage of detractors (score 1 to 6)
A cNPS above 40 is strong. Below 20 signals systemic experience problems that are affecting both offer acceptance rates and employer brand.
The most common experience failures are silence between stages, inconsistent communication, and no feedback after rejection. Each is fixable with process discipline rather than headcount.
Track cNPS by stage. A candidate who had a good experience until the offer stage and a poor experience after gives different information than one who dropped off at screening. Stage-level cNPS identifies exactly where the experience is breaking.
7. Offer-to-Joining Rate
What it measures: The percentage of candidates who accepted an offer and actually joined on Day 1.
Formula: Offer-to-joining rate = (Candidates who joined / Offers accepted) x 100
Most ATS systems mark a role as filled at offer acceptance. In India, where notice periods of 60 to 90 days are standard for mid-to-senior roles, that is the midpoint -- not the end. A candidate who accepts in January and joins in April has 12 weeks to receive a counteroffer, accept a competing position, or change their mind.
When this drops, post-offer engagement is insufficient. Build structured touchpoints during the notice period from the recruiter, from the hiring manager, from a peer on the team.
An offer-to-joining rate below 80% means more than 1 in 5 accepted offers are not converting to hires. The recruiting cost for each lost candidate is completely sunk.
The gap between tracking metrics and acting on them
Knowing which metrics to track is the easy part. Having the data available while it's still useful is the hard part.
Most TA teams find out their offer-to-joining rate dropped last quarter while assembling the end-of-month report by then, the candidates who dropped have already joined somewhere else. A 14-day panel bottleneck shows up in the weekly review after three strong candidates have already withdrawn. A sourcing channel sending the wrong candidates gets identified six weeks into a hiring drive.
The gap isn't understanding. It's timing. Funnel data that arrives after the fact explains what went wrong it doesn't prevent it.
Close the funnel gaps with RippleHire
Screening 400 applications doesn't require judgment on each one. It requires consistent application of criteria.
Scheduling interviews across four panel members doesn't require judgment. It requires calendar access.
Following up with 30 candidates through their notice period doesn't require judgment. It requires discipline and time most recruiters don't have.
When those tasks run manually, recruiters run out of time and judgment suffers at the stages where it actually matters and the coordination delays eating into that time become the reason strong candidates go elsewhere.
RippleHire is built around that split: a platform where recruiters and AI agents work together, each owning the part of the funnel they're best at. Agents apply screening criteria consistently at scale, track stage-level conversion and source quality in real time, and run notice-period touchpoints automatically. Recruiters spend their time on what actually needs a person: reading a candidate, calibrating a panel, deciding who to prioritize when two strong candidates are moving at once.
Book a RippleHire demo to see how funnel metrics become live visibility rather than end-of-month reports.
FAQs
What is a recruiting funnel?
A recruiting funnel is the structured sequence of stages that takes a candidate from first awareness of a role to joining as an employee. It is called a funnel because the number of candidates reduces at each stage as requirements become more specific. The eight stages are awareness, application, screening, assessment, interview, offer, background check, and onboarding. The goal is not to maximize the number of candidates at each stage but to convert the right candidates efficiently at every stage.
What is the most important recruiting funnel metric?
There is no single most important metric ,they form a diagnostic system. Application completion rate reveals JD and process quality. Channel conversion rate reveals sourcing efficiency. Screening-to-interview rate reveals pool quality and criteria calibration. Interview-to-offer rate reveals panel consistency. Offer acceptance rate reveals compensation competitiveness. Offer-to-joining rate reveals post-offer engagement quality. Each answers a different question about where the funnel is working and where it is not.
How to calculate the conversion rate at each funnel stage?
Stage conversion rate = (Candidates advancing to next stage / Candidates in current stage) x 100. Track this by stage, role type, recruiter, and hiring manager. A conversion rate that looks healthy in aggregate can hide a specific stage, geography, or hiring manager responsible for most of the drop-off. Stage-level tracking by these dimensions reveals the specific cause of a funnel problem rather than just confirming that one exists.
What is candidate NPS and why does it matter for funnel optimization?
Candidate Net Promoter Score measures how likely candidates are to recommend the hiring organization to others regardless of whether they received an offer. It is calculated as the percentage of candidates who rate the experience 9 or 10 minus the percentage who rate it 1 to 6.Candidates who had a poor experience tell their networks.
How does the recruiting funnel change at high volume?
At high volume, the same funnel stages break in different places. Manual screening at 3,000 applications a month cannot apply consistent criteria. Panel scheduling for 200 interviews in two weeks overwhelms coordinator capacity. Post-offer engagement across 40 simultaneous notice periods cannot be managed individually. High-volume hiring requires automation at the coordination stages -screening, scheduling, and post-offer communication so that recruiter capacity is directed toward the decisions that require human judgment, not the tasks that require human time.