
.svg) Product
Product


.png)


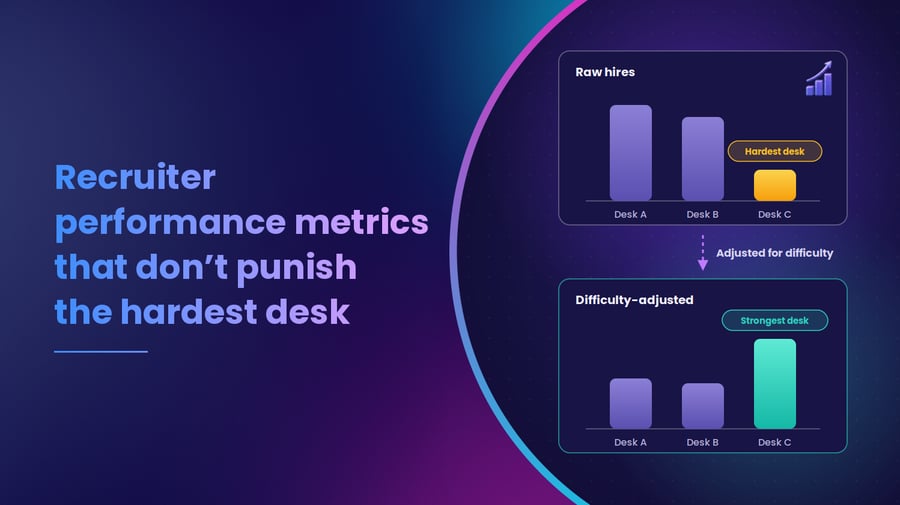


Table of content
Your CHRO asks a fair question at the quarterly review: which of your recruiters are the strongest? The slide you bring ranks nine recruiters on the two recruiter performance metrics most teams report, days to fill and SLA %. The name at the top ran the campus and BPO volume drives. The name at the bottom spent the quarter on senior data engineers for a business unit that took three weeks to return feedback on each shortlist. The slide counts every one of those weeks against the recruiter.
Try a test on that slide. Swap the top and bottom recruiters' requisitions on paper. If you think their places would swap too, the ranking is measuring desks (the mix of requisitions each recruiter was handed), and it is already changing behavior. Ratings and increments follow it, so the recruiter on the hard desk has every reason to stop taking hard roles, or to leave, and everyone else learns that the easy desk pays.
A recruiter who fills in 61 days can be outperforming one who fills in 24, and a team average will never show it. Measure each recruiter against what their own requisitions should have taken, and the 61-day recruiter can come out ahead. TA Ops can build that in a spreadsheet before your next review.

Which recruiter performance metrics should you track?
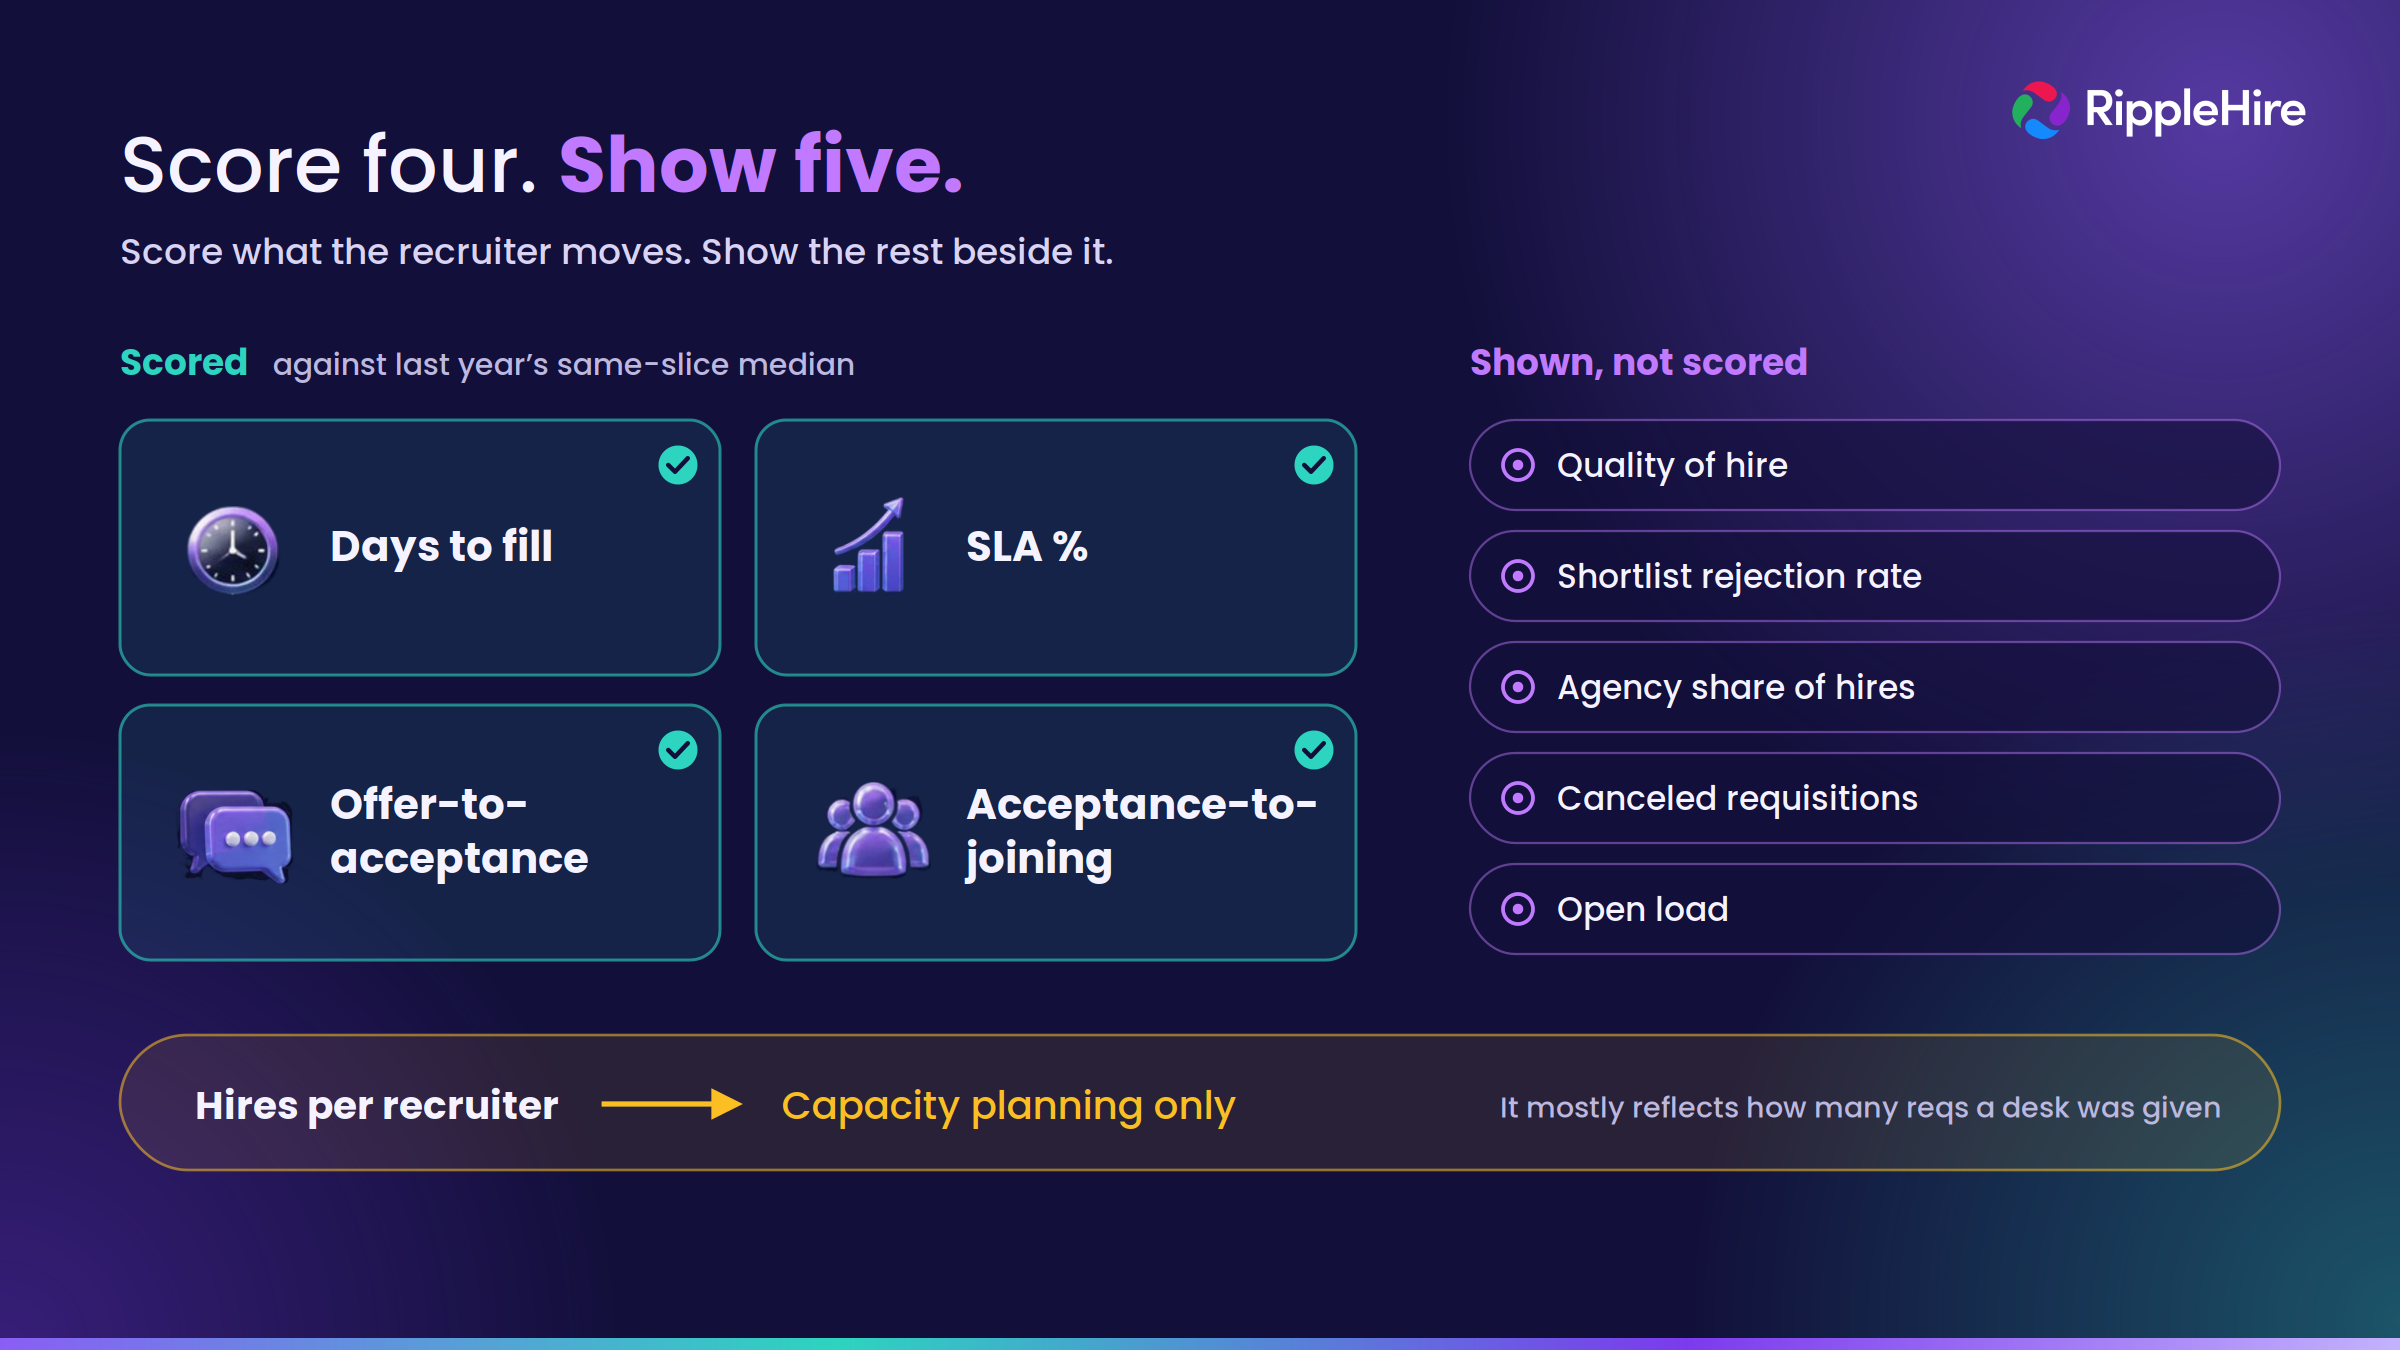
Score four: days to fill, SLA %, offer-to-acceptance and acceptance-to-joining, each compared with what the same kind of requisition achieved last year. Show five more beside the score without counting them. Leave hires per recruiter to capacity planning, since it mostly reflects how many requisitions a desk was given.
| Metric | On the scorecard | Who else shapes it |
|---|---|---|
| Days to fill | Scored | The business unit, through its feedback speed |
| SLA % | Scored | The business unit, through the date it agreed |
| Offer-to-acceptance | Scored | The business, through the pay band it sets |
| Acceptance-to-joining | Scored | The candidate's notice period |
| Quality of hire: the hiring manager's probation rating, and anyone who left before it | Shown | The hiring manager, who picks the candidate and gives the rating |
| Shortlist rejection rate: the share of shortlisted profiles the hiring manager rejects | Shown | The hiring manager, through how clear the brief was |
| Agency share of hires | Shown | The role, since agencies are sometimes right for scarce ones |
| Canceled requisitions | Shown | The business, which makes the call |
| Open load | Shown | You, since you set it |
Every metric has someone else's hand on it. So score a metric only if the recruiter's own work still moves it once each recruiter is compared with similar requisitions from last year. Offer-to-acceptance passes. A tight pay band hurts every recruiter hiring into that business unit, so the comparison absorbs it, and what is left is the recruiter's work, such as settling salary expectations before the offer. Quality of hire fails. It turns on the manager's choice and on months of managing the new joiner, and no benchmark can separate the recruiter's part from those.
Why recruiter performance metrics end up measuring the desk
Days to fill, SLA % and hires per recruiter, the usual recruiter productivity metrics, are each shaped by three things the recruiter didn't choose.
- How scarce the role is. A Java developer with three years' experience in Bengaluru usually draws a deep pool. A machine-learning platform lead at a GCC may draw a handful.
- Where it is. The same customer-support role draws a different pool in Pune than in Indore, at different salary expectations.
- How fast the business unit moves. Slow shortlist feedback, a brief that changes after the first shortlist, and missing interview feedback all run on the recruiter's clock.
How to measure recruiter performance against what the work should take
Set the expected values from last year and score recruiters on this year. Because the two periods never overlap, nobody is judged against a benchmark their own current work helped set.
-
Pull last year's closed requisitions, with role family, business unit, location, source, recruiter, and the dates of approval, offer and joining. Start the days-to-fill clock at approval, and report the wait for approval in the business unit's review.
-
Group them into a few slices that behave differently: volume or lateral, scarce role families, business units slow with shortlist feedback, metro or tier-2. Start broad, and split a slice only when each half would still hold 20 or more requisitions from last year, enough for a median you can trust.
-
Set each slice's expected value on the four scored metrics. Use the median, so the one requisition that stalled for six months doesn't set the bar.
-
Score each recruiter's requisitions this quarter as an index against those expected values. An index of 1.00 means the recruiter delivered what the work predicted, and above 1.00 is better. For days to fill, where fewer is better, divide expected by actual: 68 expected days against a 61-day median gives 1.11. For SLA % and the two ratios, where higher is better, divide actual by expected. If a recruiter's requisitions fall into several slices, index each slice, then weight each slice's index by requisitions closed. With numbers this small, treat differences within about 0.1 as noise.
The two recruiters from the opening, rescored
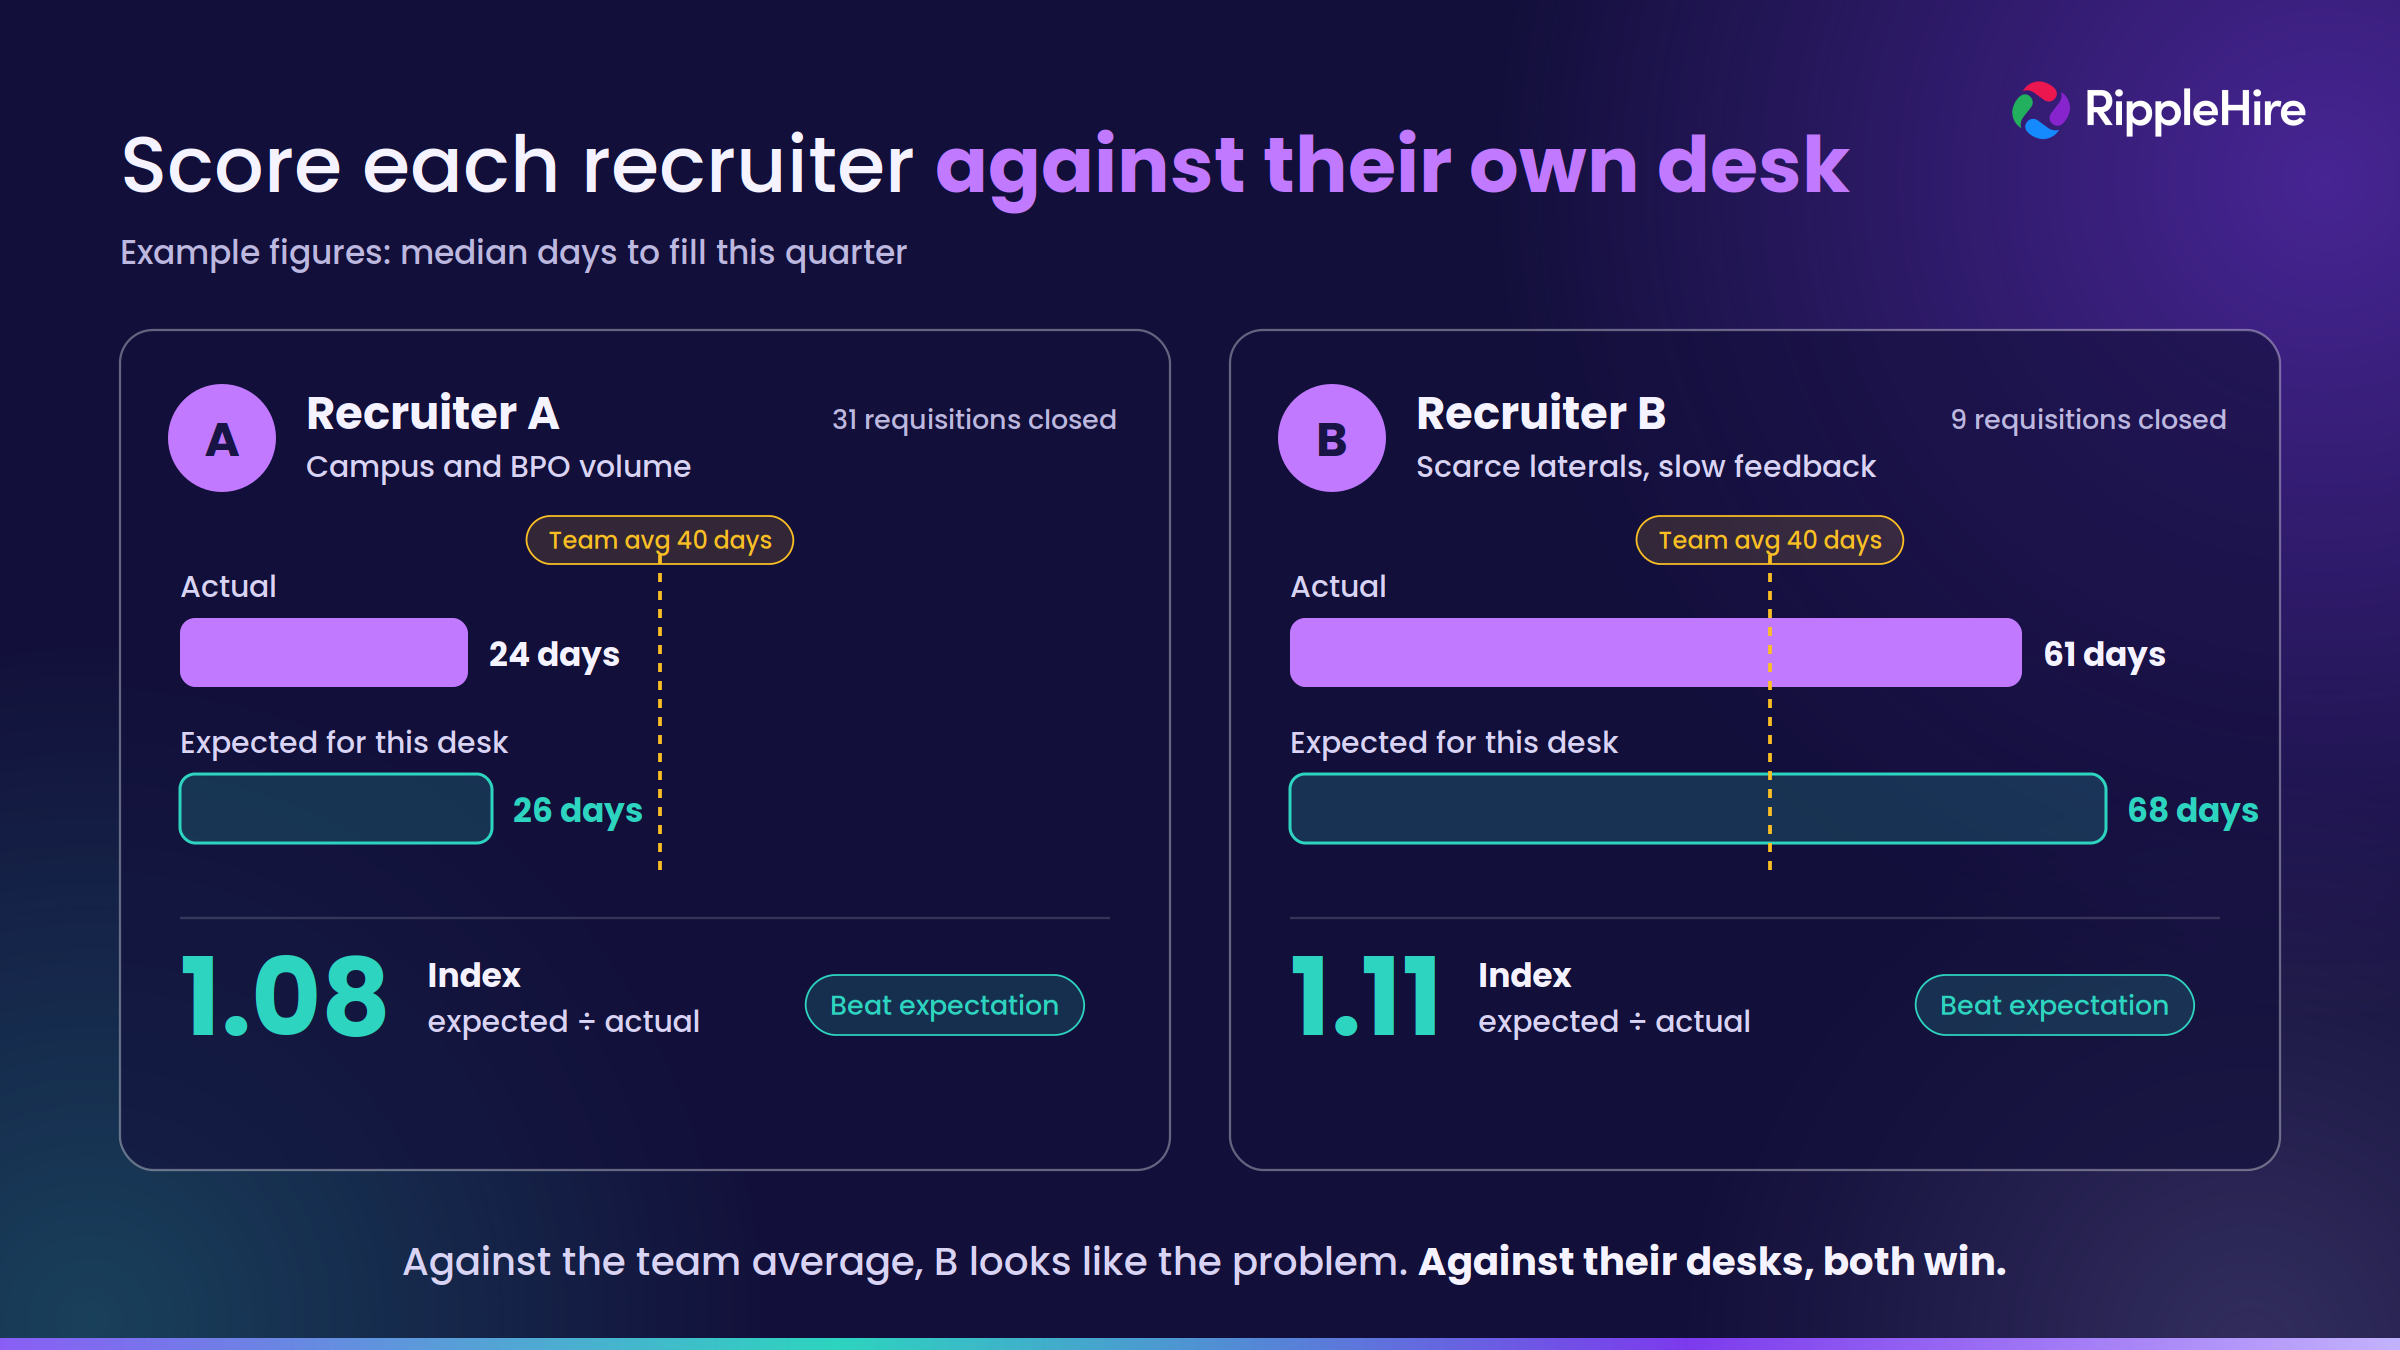
Example figures for this quarter.
| Recruiter | Desk | Requisitions closed this quarter | Median days to fill | Expected (last year's slice median) | Index |
|---|---|---|---|---|---|
| A | Campus and BPO volume | 31 | 24 | 26 | 1.08 |
| B | Scarce lateral roles, slow shortlist feedback | 9 | 61 | 68 | 1.11 |
Against a team average of 40 days, A looks like the star and B looks like the problem. Against their own slices, both beat expectation by about the same margin. The review question changes from what is wrong with B to what B does on a hard desk that others could copy.
Leadership will still want one number per recruiter, so average the four indices. If B scores 1.11 on days to fill, 1.05 on SLA %, 0.98 on offer-to-acceptance and 1.02 on acceptance-to-joining, B's overall index is 1.04. Weight the four equally unless you agree other weights before the quarter starts, because weights chosen after the results look chosen to suit a name.
Requisitions that stay open, get canceled or pile up
Scoring only closed requisitions leaves a gap. A recruiter could let the hardest ones sit open, or drift until the business cancels them, and keep a clean index.
- Open and late. A stuck requisition should cost the recruiter in every quarter it runs late. So one still open at quarter end, and already past its slice's expected days, counts in that quarter's index at the days it has run so far, and again next quarter at its new total. The year-to-date index counts it once, at its latest total.
- Canceled. These leave the index, because the business usually makes the call. They stay on the page with the days each had run and the reason given. Late requisitions that keep ending in cancellation are a question for the review.
- Load. A recruiter carrying more open requisitions than their desk carried last year will usually post a weaker index for reasons unrelated to skill. That is a staffing problem, and yours to fix before it becomes someone's rating.
Small desks and one-person slices
One stalled hire can swing an index built on five or six requisitions. So set a minimum, such as eight closed in the quarter. Score anyone below it on the year to date instead.
Some slices had only one recruiter last year. Their expected value is that recruiter's own past, so the index only shows whether they beat themselves. Mark these "own baseline" and keep them out of any ranking. If another slice had a similar median last year, merge the two so there is a real comparison.
Who sets the expected values, and when they change
TA Ops builds the slices and refreshes the data each month. The TA head signs off the expected values once a year, so nobody chases a moving target.
Flag a quarter that holds Diwali or a campus season before anyone ranks it. Naukri JobSpeak's December 2025 report said its October 2025 index fell 9% year on year because Diwali came earlier that year (Naukri JobSpeak (Info Edge), Dec 2025).
Reset a slice early only when its conditions change sharply, such as a business unit's feedback getting much faster or slower, or demand for its role family moving a long way. Naukri JobSpeak's September 2025 report put hiring for AI-ML roles up 54% year on year in August 2025 (Naukri JobSpeak (Info Edge), Sep 2025). After a shift on that scale, last year's median may no longer describe the work on that desk.
Build the recruiter scorecard so shortcuts show up
Once a number carries the review, recruiters learn to move it. Each obvious shortcut improves a speed number and worsens a later one, so the scorecard puts the later number on the same page.
| Speed number | The shortcut | Where its cost shows up |
|---|---|---|
| Days to fill | An offer made before salary expectations are settled | Offer-to-acceptance, as declined offers |
| Days to fill | An offer near the SLA date to a candidate who hasn't resigned | Acceptance-to-joining, as dropouts during the notice period |
| Days to fill | A weaker candidate pushed to an offer because the clock is running | Quality of hire |
| Days to fill | A hard requisition sent to agencies so it closes fast | Agency share of hires, and fees paid from a budget the scorecard never sees |
| SLA % | Padded shortlists sent early to stay on track for the agreed date | Shortlist rejection rate |
The agency row is the one most rankings miss, because the fee never touches the recruiter's numbers. Read each recruiter's agency share against how much their slice used agencies last year.
Long notice periods, often 60–90 days in IT services, leave a long gap between offer acceptance and joining, so compare acceptance-to-joining only within the same notice-period band. Offer-to-acceptance moves with what happened earlier in the process, so read it beside the recruiting funnel metrics that feed it.
Record assignments, handovers and stalls as fields you can count
A slow number starts an argument unless the reason is on record, and nobody can count a comment that reads "HM on leave, will revert". Three fields usually settle it, each held in an ATS dropdown or a spreadsheet column.
- Who chose the requisition. A recruiter who can choose is likely to take the easier requisitions in each slice, often without meaning to. Easy requisitions flatter the speed number and its cost number together, so nothing else on the scorecard catches it. Log who assigned each requisition and whether the recruiter asked for it, and self-chosen requisitions that keep beating their slice will stand out.
- Who held it. A recruiter who takes over a requisition inherits days they never had. So a handed-over requisition counts in neither recruiter's days-to-fill index, and offer and joining outcomes go to whoever made the offer. To stop recruiters passing on stuck requisitions, one already past its slice's expected days when it changed hands stays in the first recruiter's index, at the days it ran on their desk. Every handover also needs the TA manager's approval and a logged reason.
- Why it stalled. Pick the reason from a short list, with the date it started and the date it cleared: shortlist feedback pending, interview feedback pending, brief changed after the shortlist, scarce skill, vendor delay, candidate serving notice period. Totaled by business unit, this field shows which units have slowed since last year, with dates you can take to the unit's head.
Logged stall days stay in the days-to-fill score. The slice's expected value already includes the business unit's usual feedback delay, so removing them would allow for that delay twice. The record explains the number instead. A 61-day fill on B's desk reaches the review as 19 days waiting for shortlist feedback, 11 after the brief changed and 31 the recruiter controlled. The index still compares the full 61 days with the slice's 68.
Run the index beside your current ranking for one quarter
Start with the desk you most suspect your ranking misreads, and rescore its last two quarters with the four steps above. If the order changes, you have the case for your CHRO.
For the first full quarter, run the index next to your current ranking and let neither decide ratings. Where they disagree, read the requisitions behind the gap, which is where slow business units and badly drawn slices show up.
Bring the team in before the numbers count. Have two or three senior recruiters review the slice definitions, allow a few working days after quarter end to dispute a handover date or stall reason with evidence, and show each recruiter their own index before it reaches the deck.
Where a system helps
Everything above runs in a spreadsheet. The work is the monthly refresh: cutting the data by business unit, location and recruiter, spotting requisitions that are running late, and tracing where slow ones lost time.
RippleHire's reports take on that work. Fulfilment Metrics tracks Joiners, Joiner SLA % and Average Fulfilment Days, with filters for jobs, job locations, campaigns, recruiters, business units and departments that combine to show one slice at a time. Job Ageing highlights open jobs by how long they have been active, and Turnaround Time shows the time taken at each hiring stage. Summary metrics drill down to row-level data, and any report can be exported to Excel.
Recruiter Performance shows each recruiter's total, open, canceled and joined positions, SLA %, average fulfil days, offer and joining ratios, and a hiring channel breakdown that includes agency hires. It compares each recruiter with the overall organizational average, which is the comparison this post argues against, so use its export as the input to your index.
Explore RippleHire Hiring Controls & Visibility →
If the bottom of your ranking is always whoever holds the hardest desks, the benchmark is usually what needs fixing. Book a RippleHire demo and we will show you Fulfilment Metrics cut slice by slice, Job Ageing for requisitions running late, and the export your TA Ops team would score.
Frequently asked questions
How many hires per recruiter should an enterprise in India plan for?
No single figure holds across desks, so set it per desk from your own history. Divide the joiners a desk produced last year by the recruiters who worked it, then by four quarters. If three lateral recruiters produced 36 joiners, plan on three joiners per recruiter per quarter. Then convert it into accepted offers: if the desk loses one accepted candidate in five during notice periods, each recruiter needs about four accepted offers a quarter.
How do you measure recruiter performance without a year of clean history?
Use only past requisitions whose approval and joining dates were actually recorded. Don't rebuild missing dates from memory, because guessed dates tend to flatter whoever does the guessing. If that leaves too few, start recording the fields now, treat the first two quarters as the baseline and score from the third. Until then, compare recruiters only with others on the same slice, and keep the index out of ratings. Thin history also supports fewer, broader slices.
What recruitment metrics should a CHRO in India review every month?
Keep individual recruiter ranks out of the monthly CHRO pack, because a month holds too few requisitions per recruiter to judge a person. Send three desk-level views instead: each desk's index against its expected values, the requisitions running past their expected days with the business unit that owns each, and stall days totaled by business unit. The last view points the review at the units slowing hiring down, a conversation a CHRO can usually move faster than a TA head can.
How often should you review recruiter performance?
Look at the data monthly, score quarterly and rate once a year. Each month, use open requisitions and stalls to coach. Each quarter, run the index, then take five requisitions from the top two and bottom two recruiters and read them from start to finish. Files show what averages can't, such as an offer made before the candidate resigned. For ratings and increments, use the year-to-date index, so one bad quarter on a hard desk doesn't decide a year.